Top 10 Data Visualization Software Comparison
By Sheila Morgan | Published: 2023-10-27 | Category: Data Visualization Software
About Data Visualization Software
Data visualization software transforms raw datasets into graphical representations like charts, graphs, maps, and dashboards. These tools help users identify patterns, trends, and outliers, making complex data more understandable and actionable.
Scoring Criteria
- → Ease of Use
- → Visualization Variety
- → Data Connectivity
- → Collaboration Features
- → Integration Capabilities
- → Pricing/Value
- → Performance
- → Support & Community
The Best Data Visualization Software
 #10
#10
MicroStrategy
By MicroStrategy Incorporated
A long-standing enterprise BI platform known for its robust architecture, governance, scalability, and comprehensive feature set.
Platforms & Use Cases
Platforms: Web, Desktop (Windows, macOS), Mobile (iOS/Android)
Best For: Enterprise Reporting, Governed Business Intelligence, Federated Analytics, Mobile Analytics, HyperIntelligence (Contextual Insights)
Key Features
- ✓Enterprise Semantic Graph: Centralized metadata layer providing consistency and governance across reports and dashboards.
- ✓Dossiers: Modern, interactive dashboards combining data from multiple sources.
- ✓HyperIntelligence: Zero-click insights delivered as cards appearing over relevant keywords in web applications.
- ✓Scalability and Performance: Architected for large user bases and massive datasets.
- ✓Platform SDK: Extensive SDKs and APIs for customization and embedding.
Scorecard (Overall: 7.4 / 10.0)
Pricing
Free Desktop Version (Workstation)
Contact Vendor
- Connect to data
- Build Dossiers
- Personal use
Limitations: Limited sharing/collaboration
Cloud
Contact Vendor
- Managed cloud service
- Various user roles (Author, Explorer, Viewer)
Limitations: Requires sales quote
On-Premises
Contact Vendor
- Self-hosted deployment
- Full platform capabilities
Limitations: Requires infrastructure, Requires sales quote
Pros
- + Strong governance and security features
- + Highly scalable architecture
- + Comprehensive BI capabilities
- + Innovative features like HyperIntelligence
- + Robust mobile offering
Cons
- - Complex platform with a steeper learning curve
- - Can be expensive
- - User interface feels less modern than some competitors
- - Requires significant setup and administration
Verdict
"A powerful, enterprise-grade platform ideal for large organizations needing robust governance, scalability, and a wide array of BI functionalities."
 #9
#9
ThoughtSpot
By ThoughtSpot Inc.
Focuses on search-driven analytics, allowing users to ask questions of their data using natural language and get instant AI-generated answers and visualizations.
Platforms & Use Cases
Platforms: Web, Mobile (iOS/Android)
Best For: Self-Service Analytics, Natural Language Query, AI-Driven Insights, Faster Ad-hoc Analysis, Embedded Search Analytics
Key Features
- ✓Search-Based Analytics: Type questions in a search bar to analyze data and generate visualizations.
- ✓SpotIQ (AI Engine): Automatically uncovers hidden insights, anomalies, and trends in the data.
- ✓Liveboards: Interactive dashboards built from search results and user-created charts.
- ✓Data Modeling (Worksheets): Define curated data sources optimized for search.
- ✓Relational Search Engine: Proprietary engine designed for fast, ad-hoc queries across large datasets.
Scorecard (Overall: 7.1 / 10.0)
Pricing
Team
$95.00 / Monthly Per User (minimum 5 users)
- Up to 5 users
- Search & AI
- Liveboards
Limitations: User limit, Limited data scale
Pro
Contact Vendor
- Unlimited users
- Scalable compute
- Advanced security
- Embedding options
Limitations: Usage-based pricing complexity, Requires sales quote
Enterprise
Contact Vendor
- Dedicated environment
- Premium support
- Full feature set
Limitations: Highest cost tier, Requires sales quote
Pros
- + Excellent natural language search capabilities
- + Fast time-to-insight for ad-hoc questions
- + AI-driven insights generation
- + Intuitive for non-technical users
Cons
- - Less focus on intricate dashboard design and pixel-perfect reporting
- - Can be expensive
- - Requires good data modeling (Worksheets) upfront for best results
- - Visualization types more limited than Tableau/Power BI
Verdict
"A leader in search-driven analytics, perfect for organizations wanting to empower business users to ask ad-hoc questions directly without complex report building."
User Reviews
Add Your Review
Loading reviews...
 #8
#8
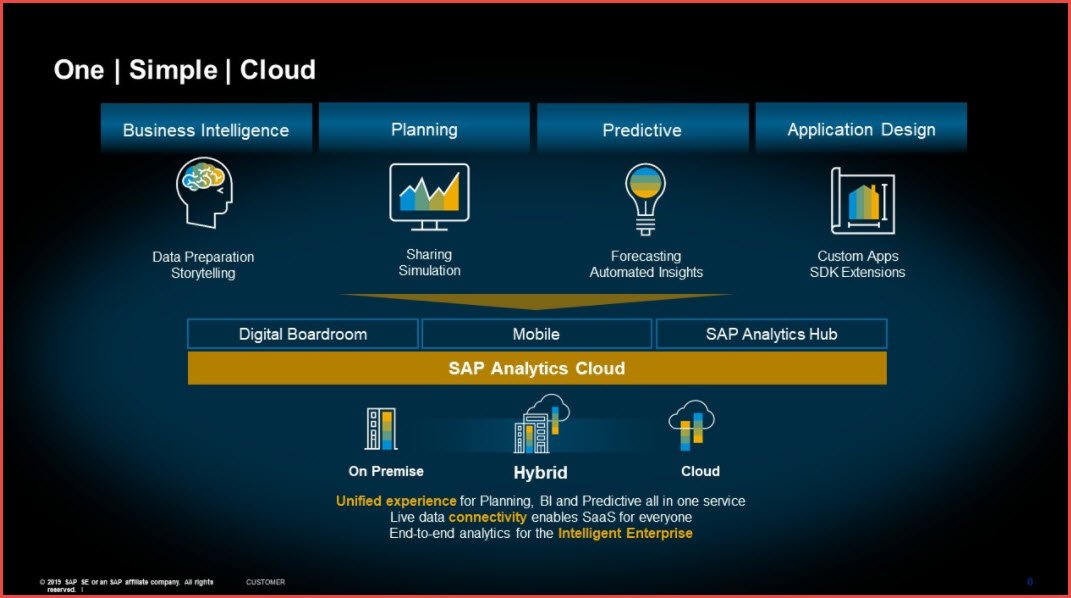
SAP Analytics Cloud
By SAP
A cloud-based solution integrating BI, planning, and predictive analytics, tightly connected with the SAP ecosystem.
Platforms & Use Cases
Platforms: Web, Mobile (iOS/Android)
Best For: Business Intelligence, Financial Planning & Analysis, Predictive Forecasting, Integration with SAP Systems, Enterprise Reporting
Key Features
- ✓Unified Platform: Combines BI (reporting/dashboards), Planning (budgeting/forecasting), and Augmented Analytics (predictive).
- ✓Smart Insights / Search to Insight: AI-driven features for automated analysis and natural language queries.
- ✓Deep SAP Integration: Native connectivity and integration with SAP HANA, S/4HANA, BW, and other SAP applications.
- ✓Planning Capabilities: Robust tools for financial and operational planning integrated with analytics.
- ✓Digital Boardroom: Interactive presentation layer for executive reporting.
Scorecard (Overall: 7.2 / 10.0)
Pricing
Business Intelligence
$36.00 / Monthly Per User
- Data exploration
- Dashboards
- Reporting
- Mobile access
Limitations: Planning/Predictive features limited
Planning
Contact Vendor
- BI features plus budgeting, forecasting, scenario modeling
Limitations: Requires custom quote
Trial
Contact Vendor
- Limited time access to explore features
Limitations: Time-bound, Feature restrictions
Pros
- + Seamless integration with SAP data sources
- + Combines BI, planning, and predictive analytics
- + Strong enterprise governance features
- + Cloud-based deployment
Cons
- - Can be expensive, especially for Planning features
- - Steeper learning curve
- - Best suited for organizations already invested in SAP ecosystem
- - Less flexible visualization compared to pure-play BI tools
Verdict
"Primarily recommended for organizations heavily reliant on SAP systems, offering a unified platform for analytics and planning within that ecosystem."
User Reviews
Add Your Review
Loading reviews...
 #7
#7
Zoho Analytics
By Zoho Corporation
A self-service BI and analytics platform, part of the broader Zoho suite, offering strong value and a wide range of integrations.
Platforms & Use Cases
Platforms: Web, Desktop (Windows, macOS, Linux), Mobile (iOS/Android)
Best For: Business Intelligence, Sales & Marketing Analytics, Integration with Zoho Apps, Small to Medium Business Reporting, Embedded Analytics
Key Features
- ✓Drag-and-Drop Report Builder: Intuitive interface for creating reports and dashboards.
- ✓Zia (AI Assistant): Ask questions in natural language, get automated insights and predictions.
- ✓Wide Range of Connectors: Connects to files, feeds, databases, cloud storage, and popular business applications.
- ✓Zoho Ecosystem Integration: Seamless data flow from other Zoho products (CRM, Books, etc.).
- ✓White Label & Embedding Options: Rebrand the platform or embed reports into other applications.
Scorecard (Overall: 7.6 / 10.0)
Pricing
Free Plan
Contact Vendor
- 2 Users
- 10,000 Rows
- Limited features
Limitations: User/Row limits, Basic support
Basic
$24.00 / Monthly (billed annually)
- 2 Users
- 0.5 Million Rows
- Unlimited reports/dashboards
Limitations: User/Row limits
Standard
$48.00 / Monthly (billed annually)
- 5 Users
- 1 Million Rows
- Data alerts
- Hourly data sync
Limitations: User/Row limits
Premium
$115.00 / Monthly (billed annually)
- 15 Users
- 5 Million Rows
- Zia Insights
- Data snapshots
Limitations: Higher tier available for more resources
Enterprise
$445.00 / Monthly (billed annually)
- 50 Users
- 50 Million Rows
- Advanced analytics features
- White labeling
Limitations: Contact for higher needs
Pros
- + Excellent value, especially for existing Zoho users
- + Good range of features for the price
- + User-friendly interface
- + Strong integration capabilities, particularly within Zoho suite
Cons
- - Performance might lag with very large datasets compared to leaders
- - Visualization customization less flexible than Tableau
- - Advanced analytics features less mature than some competitors
Verdict
"A very strong contender for SMBs, especially those using other Zoho products, offering a comprehensive feature set at competitive prices."
User Reviews
Add Your Review
Loading reviews...
 #6
#6
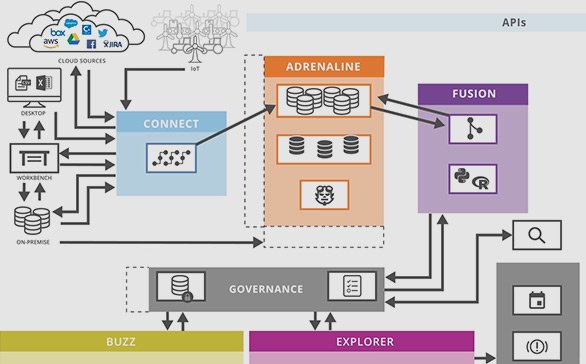
Sisense
By Sisense Inc.
An API-first platform designed for embedding analytics into workflows and products, also offering full-stack BI capabilities.
Platforms & Use Cases
Platforms: Web, Desktop (Windows for ElastiCube Manager)
Best For: Embedded Analytics, OEM Analytics, Business Intelligence, Complex Data Mashups, Custom Analytic Applications
Key Features
- ✓Elasticube / Live Connect: Option for high-performance in-memory database (Elasticube) or direct query.
- ✓API-First Design: Built for customization and embedding, with extensive APIs.
- ✓Single-Stack Architecture: Combines data preparation, analysis, and visualization in one platform.
- ✓Sisense BloX: Create custom, actionable analytic widgets and applications.
- ✓AI Throughout: Features like natural language query, statistical analysis, and anomaly detection.
Scorecard (Overall: 7.4 / 10.0)
Pricing
Custom Pricing
Contact Vendor
- Based on data volume
- User counts
- Deployment type
- Features
Limitations: Requires sales consultation, Typically billed annually
Pros
- + Excellent for embedded analytics scenarios
- + Highly customizable and extensible via APIs
- + Powerful data engine (Elasticube)
- + Single platform for various BI needs
Cons
- - Pricing complexity and potentially high cost
- - Learning curve for advanced customization and embedding
- - Full potential requires developer resources
Verdict
"A top choice for companies needing to deeply embed analytics into their own products or workflows, offering flexibility and power."
User Reviews
Add Your Review
Loading reviews...
 #5
#5
Domo
By Domo, Inc.
A cloud-native platform combining BI, data integration, and app development features, focusing on real-time business insights.
Platforms & Use Cases
Platforms: Web, Mobile (iOS/Android)
Best For: Business Intelligence, Executive Dashboards, Data Integration, Operational Alerts, Custom Business Apps
Key Features
- ✓End-to-End Platform: Integrates data connection, ETL, visualization, and distribution in one cloud solution.
- ✓Real-time Data: Emphasis on connecting to and visualizing frequently updating data sources.
- ✓Card-Based Visualization: Uses 'cards' as the building blocks for dashboards, representing individual metrics or charts.
- ✓Mr. Roboto (AI Engine): AI capabilities for alerts, insights, and predictive analytics.
- ✓App Framework: Build custom applications on top of the Domo platform.
Scorecard (Overall: 7.4 / 10.0)
Pricing
Custom Pricing
Contact Vendor
- Based on data usage
- Number of users
- Features enabled
- Storage
Limitations: Complex, usage-based pricing, Requires sales contact
Pros
- + Comprehensive platform covering ETL to visualization
- + Strong mobile experience
- + Good collaboration and social features
- + Extensive connector library
Cons
- - Complex pricing model can be costly
- - Visualization customization sometimes limited compared to leaders
- - Can feel overwhelming due to the breadth of features
Verdict
"A powerful, integrated cloud platform suitable for businesses wanting an all-in-one solution, particularly those needing strong mobile access and collaboration."
User Reviews
Add Your Review
Loading reviews...
 #4
#4
Looker
By Google (Google Cloud)
A web-based platform focused on data modeling (LookML) to create a reliable, governed data source for exploration and visualization.
Platforms & Use Cases
Platforms: Web
Best For: Business Intelligence, Embedded Analytics, Data Application Platform, Centralized Data Modeling, Marketing & Sales Analytics
Key Features
- ✓LookML Modeling Layer: Define dimensions, aggregates, calculations, and data relationships in a reusable, version-controlled semantic layer.
- ✓Web-Based Interface: Fully browser-based platform for modeling, analysis, and visualization.
- ✓Data Exploration ('Explores'): Users can easily select fields and filters from modeled data to create ad-hoc reports.
- ✓Embeddable Analytics: Robust options for embedding dashboards and reports into other applications.
- ✓Integration with Google Cloud: Leverages Google Cloud infrastructure and integrates with services like BigQuery.
Scorecard (Overall: 7.5 / 10.0)
Pricing
Custom Pricing
Contact Vendor
- Platform access
- User types (Viewer, Standard, Developer)
- Number of connections
- Support level
Limitations: Pricing is not transparent; requires consultation, Can be expensive
Pros
- + Strong data governance through LookML
- + Powerful embedding capabilities
- + Web-based, no desktop install needed
- + Scalable architecture (especially on GCP)
Cons
- - Requires learning LookML, significant upfront modeling effort
- - Visualization options less extensive than Tableau/Power BI
- - Opaque and potentially high pricing
- - Less intuitive for pure self-service visualization users
Verdict
"Best suited for data-mature organizations needing a governed, scalable, and embeddable analytics platform, particularly those using Google Cloud."
User Reviews
Add Your Review
Loading reviews...
 #3
#3
Qlik Sense
By Qlik
Features a unique Associative Engine allowing users to explore data freely without predefined hierarchies, uncovering hidden insights.
Platforms & Use Cases
Platforms: Desktop (Windows), Web, Mobile (iOS/Android)
Best For: Exploratory Data Analysis, Guided Analytics Applications, Embedded Analytics, Sales Performance, Supply Chain Optimization
Key Features
- ✓Associative Engine: Explore relationships across all data, instantly updating visualizations based on selections anywhere.
- ✓Augmented Intelligence (Insight Advisor): AI-driven suggestions for charts, associations, and insights.
- ✓Self-Service Visualization: Drag-and-drop interface for users to create their own visualizations and dashboards.
- ✓Governed Data Models: Allows IT to create secure and governed libraries of data, measures, and dimensions.
- ✓Open APIs: Extensive APIs for embedding analytics into other applications.
Scorecard (Overall: 7.8 / 10.0)
Pricing
Qlik Sense Business
$30.00 / Monthly Per User (billed annually)
- Self-service analytics
- Shared spaces
- Automated data refreshes
Limitations: Group size limits, Annual billing requirement
Qlik Sense Enterprise SaaS
Contact Vendor
- Unlimited shared/managed spaces
- Larger app sizes
- Direct query options
- Choice of user types (Professional/Analyzer)
Limitations: Requires contacting sales for pricing
Qlik Sense Enterprise (Client-Managed)
Contact Vendor
- On-premises or private cloud deployment
- Full control over environment
Limitations: Requires infrastructure management, Contact sales for pricing
Pros
- + Powerful Associative Engine enables unique data exploration
- + Strong performance with large datasets
- + Good augmented analytics features
- + Flexible deployment options
Cons
- - User interface can be less intuitive than competitors
- - Pricing can become complex for Enterprise
- - Steeper learning curve for data modeling
Verdict
"Ideal for organizations needing powerful, associative data exploration beyond simple dashboards, particularly with complex datasets."
User Reviews
Add Your Review
Loading reviews...
 #2
#2
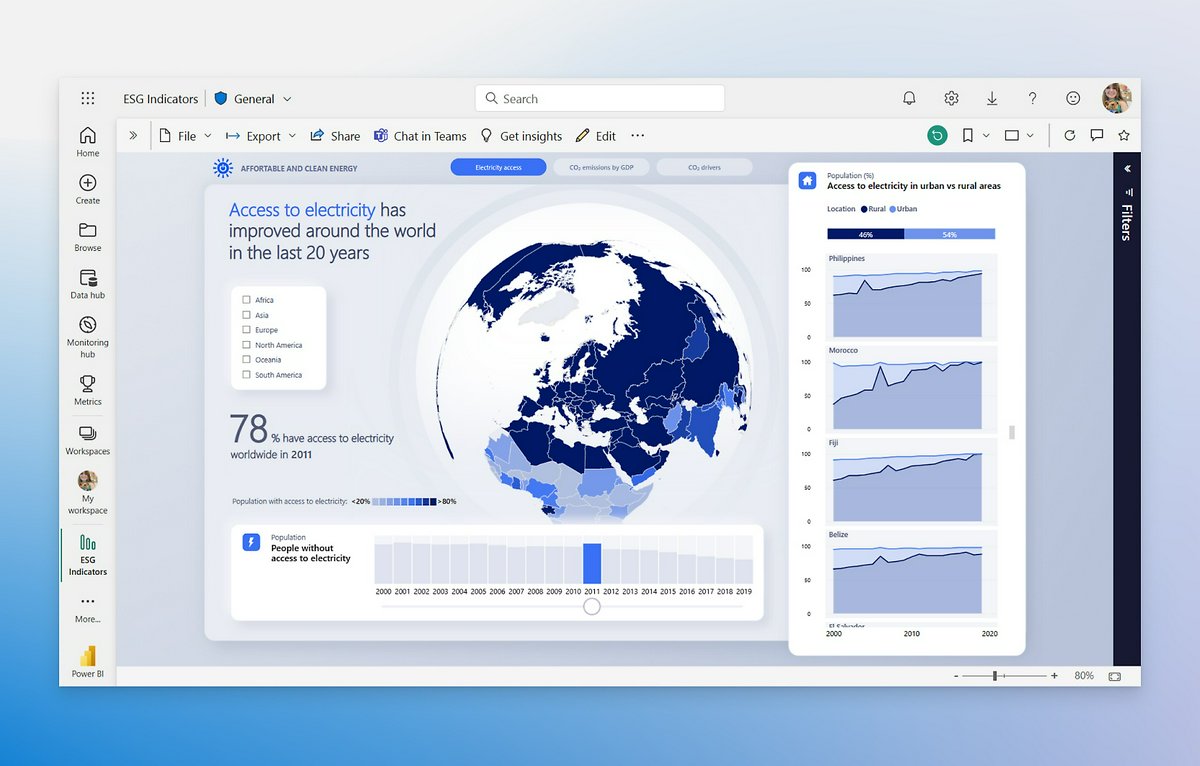
Microsoft Power BI
By Microsoft
A comprehensive BI platform tightly integrated with the Microsoft ecosystem, offering strong visualization capabilities at a competitive price.
Platforms & Use Cases
Platforms: Desktop (Windows), Web, Mobile (iOS/Android)
Best For: Business Intelligence, Self-Service Analytics, Reporting Automation, Sales & Operations Monitoring, Integration with Office 365
Key Features
- ✓Interactive Reports & Dashboards: Build and share dynamic reports with a variety of visuals.
- ✓Power Query: Robust data transformation and preparation engine integrated within the tool.
- ✓DAX (Data Analysis Expressions): Powerful formula language for custom calculations and measures.
- ✓Natural Language Q&A: Ask questions about data in plain language.
- ✓Microsoft Ecosystem Integration: Seamless integration with Excel, Teams, SharePoint, Azure.
Scorecard (Overall: 8.8 / 10.0)
Pricing
Power BI Desktop
Contact Vendor
- Report creation
- Data modeling
- Extensive visualizations
Limitations: Sharing and collaboration require paid license
Power BI Pro
$10.00 / Monthly Per User
- Publish reports
- Share and collaborate
- App workspaces
- 1GB model size limit
Limitations: Limited refresh rate, Smaller storage per user
Power BI Premium Per User
$20.00 / Monthly Per User
- All Pro features
- Paginated reports
- AI insights
- Larger model size (100GB)
- Higher refresh rate
Limitations: Requires all collaborators to have PPU license
Power BI Premium (Capacity)
$4995.00 / Monthly Per Capacity
- Dedicated capacity
- Distribute content widely without per-user licenses
- On-premises reporting
Limitations: Significant minimum cost
Pros
- + Excellent value for money
- + Deep integration with Microsoft products
- + Powerful data modeling (Power Query & DAX)
- + Frequent updates and feature releases
Cons
- - Desktop client is Windows-only
- - User interface can feel cluttered
- - DAX has a steep learning curve
- - Collaboration primarily tied to Microsoft accounts
Verdict
"The best value proposition, especially for organizations heavily invested in the Microsoft ecosystem. Powerful and feature-rich."
User Reviews
Add Your Review
Loading reviews...
View Top Ranked Software
Watch a short ad to unlock the details for the #1 ranked software.
 #1
#1
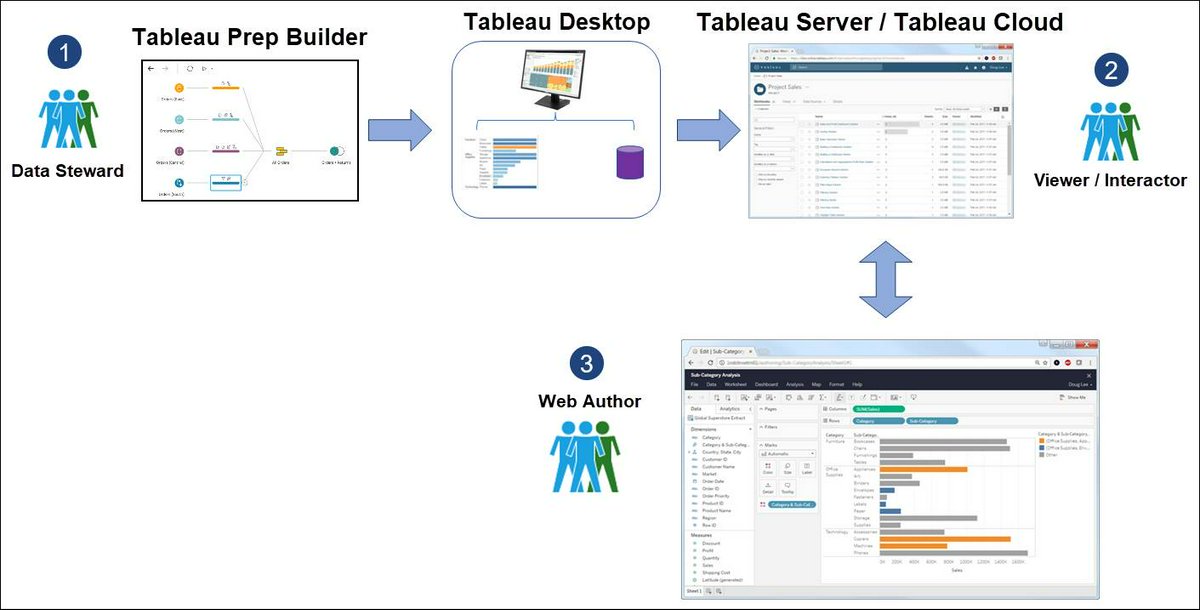
Tableau Desktop & Tableau Cloud
By Salesforce
A market leader known for its powerful interactive visualizations, intuitive drag-and-drop interface, and strong community support.
Platforms & Use Cases
Platforms: Desktop (Windows), Desktop (macOS), Web, Mobile (iOS/Android)
Best For: Business Intelligence, Exploratory Data Analysis, Sales Dashboards, Marketing Analytics, Operational Reporting
Key Features
- ✓Interactive Dashboards: Create dynamic and filterable dashboards that allow deep data exploration.
- ✓Drag-and-Drop Interface: Build complex visualizations without coding using an intuitive visual workflow.
- ✓Extensive Chart Types: Offers a wide variety of charts, graphs, and maps for diverse data representation needs.
- ✓Data Prep (Tableau Prep Builder): Clean, shape, and combine data visually before analysis.
- ✓Ask Data / Explain Data: Natural language query and automated explanations for data points.
Scorecard (Overall: 8.8 / 10.0)
Pricing
Tableau Public
Contact Vendor
- Basic visualization creation
- Publish to Tableau Public
Limitations: Workbooks are public, Limited data sources
Tableau Creator
$75.00 / Monthly Per User (billed annually)
- Tableau Desktop
- Tableau Prep Builder
- One Tableau Cloud license
Limitations: Requires annual billing
Tableau Explorer
$42.00 / Monthly Per User (billed annually)
- Explore existing dashboards
- Edit existing workbooks (web)
- Collaborate
Limitations: Cannot create new data sources/workbooks from scratch
Tableau Viewer
$15.00 / Monthly Per User (billed annually)
- View and interact with dashboards
- Subscribe to reports
Limitations: View-only access
Pros
- + Highly interactive and visually appealing dashboards
- + Powerful data exploration capabilities
- + Strong community and learning resources
- + Wide range of data connectors
Cons
- - Can be expensive, especially for larger teams
- - Steeper learning curve for advanced features
- - Prep Builder sometimes feels separate from Desktop
Verdict
"Excellent choice for organizations prioritizing deep data exploration and stunning visualizations, despite a higher price point."
User Reviews
Add Your Review
Loading reviews...

Final Thoughts
The data visualization market offers diverse tools catering to different needs. Leaders like Tableau and Power BI excel in visual analytics and usability, with Power BI offering exceptional value, especially within the Microsoft ecosystem. Qlik Sense provides unique associative exploration, Looker focuses on governed data modeling, while tools like Domo and Sisense offer broader platforms or strong embedding capabilities. Zoho Analytics presents great value for SMBs, SAP Analytics Cloud integrates tightly with SAP, ThoughtSpot pioneers search-based analytics, and MicroStrategy remains a robust enterprise choice.
User Reviews
Add Your Review
Loading reviews...
No reviews yet. Be the first to share your thoughts!